"Obesity linked to up to 27% lower risk of death in dementia" was one of the more surprising health headlines of the past week. Among 4,523 older Americans who developed dementia, those who were overweight or obese at diagnosis were less likely to die over the follow-up than those at a normal weight. The researchers themselves call it counterintuitive and say plainly that it doesn't mean anyone should gain weight. For anyone who works with data, it's a perfect teaching case. Findings like this, known as the "obesity paradox", show how the way a sample is chosen can make a harmful factor look protective. Here are the three traps, a 20-line simulation you can run, and a checklist for the next "X linked to lower risk" headline.
What the dementia study found
The study, published in the Journal of Alzheimer's Disease and summarised by ScienceDaily on 11 November, used the Health and Retirement Study, a nationally representative US survey of people aged 51 and over, with records from 1998 to 2022. It followed 4,523 people who developed dementia and looked at their weight at diagnosis. Compared with people of normal weight, and after adjusting for smoking, existing conditions and demographics, the risk of death was:
16% lower for people who were overweight (BMI 25 to 29.9)
27% lower for class 1 obesity (BMI 30 to 34.9)
22% lower for BMI 35 and above
Co-author Virginia Chang: "This doesn't mean that patients with dementia should attempt to become overweight or obese." Corresponding author Yuan Zhang asked the right question: "whether it could simply be an artifact of bias."
Trap 1: the outcome changes the exposure
The authors' earlier work found that weight loss can begin up to ten years before a dementia diagnosis. So "normal weight at diagnosis" quietly includes people who used to be heavier and lost weight because the disease was already under way. Those people may also be sicker.
Think of judging which cars are the most fuel-efficient by checking their tanks at the end of a long road trip. The cars with the emptiest tanks might just have driven the furthest. When the thing you measure is affected by the process you're studying, the comparison gets tangled.
Trap 2: selecting on a collider
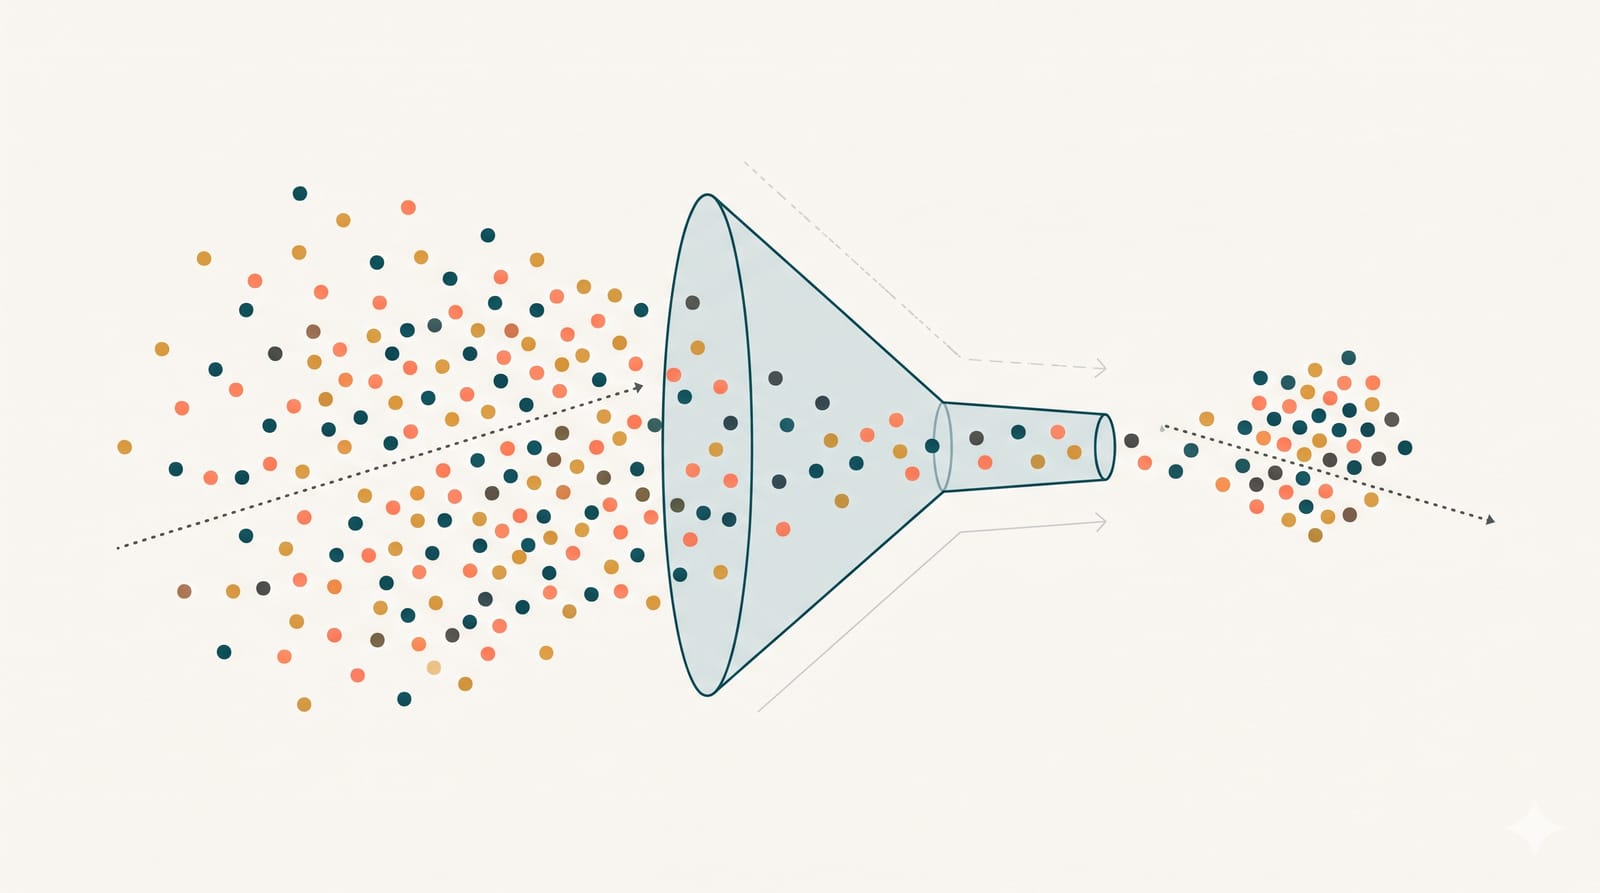
This is the subtle one. A collider is a variable caused by two other things. If you restrict your analysis to people with a certain value of the collider, you can create a link between its causes that doesn't exist in the general population.
An everyday version: imagine a club that admits people who are either very tall or very good at maths. Inside the club, tall members will tend to be worse at maths than short ones, because short members could only have got in through maths. Height and maths ability aren't related in the population, but they become related inside the club.
Now swap "club" for "people with a diagnosis." If both obesity and some other, unmeasured cause of poor health raise your chances of getting the diagnosis, then among diagnosed people, those without obesity are more likely to carry that other, more dangerous cause. Epidemiologists Hailey Banack and Jay Kaufman showed this pattern in a 2014 paper on cardiovascular disease. Using US NHANES data on 17,636 people, obesity was linked to higher mortality in the general population (adjusted risk ratio 1.24) but lower mortality among people with heart disease (0.79). Their conclusion: collider stratification bias is "one plausible explanation for the obesity paradox."
See it happen in 20 lines of Python
Here's a toy population where obesity is truly harmful, and a hidden factor ("frailty") is much worse. Both make the disease more likely.
import numpy as np

rng = np.random.default_rng(42)
n = 1_000_000

obese = rng.random(n) < 0.35
frail = rng.random(n) < 0.30          # never measured in the "study"
disease = rng.random(n) < 0.02 + 0.10 * obese + 0.40 * frail
death = rng.random(n) < 0.05 + 0.03 * obese + 0.30 * frail

def death_rate(mask):
    return death[mask].mean()

print(death_rate(obese), death_rate(~obese))                       # everyone
print(death_rate(disease & obese), death_rate(disease & ~obese))  # diagnosed only
print(frail[disease & obese].mean(), frail[disease & ~obese].mean())
The output tells the whole story:
Everyone: 17.0% of obese people die versus 14.1% of the rest. Obesity is harmful, as we built it to be.
Diagnosed only: 27.6% of obese patients die versus 32.2% of the rest. Obesity now looks protective.
Why: 90% of diagnosed non-obese people are frail, against 65% of diagnosed obese people. The non-obese patients mostly got the disease through the more dangerous route.
Nothing in the data generation changed. Only the choice of who to look at did.
Trap 3: who survived long enough to be counted
The study's authors also flag survivor bias. If obesity raises the risk of dying earlier from heart disease or diabetes, the people with obesity who live long enough to develop dementia are a hardier-than-average group. Comparing them with everyone else at diagnosis isn't a like-for-like comparison.
So is the dementia finding just bias?
Not necessarily, and that's the honest part. The researchers say their additional analyses suggested these biases were unlikely to explain the main result. And methods researchers disagree on how much collider bias matters: a 2016 modelling study by Matthew Sperrin and colleagues concluded that collider bias "can be a partial explanation" of the obesity paradox but is unlikely to flip a true causal relationship on its own. It's possible that extra reserves genuinely help people withstand a wasting illness.
What the data can't tell you is that gaining weight would help anyone. It's an observational finding about weight at diagnosis, not a test of an intervention. The same caution applies to observational fitness findings, like the long-running Swedish study on fitness after 35, and to questions of cause and effect like whether phones cause procrastination.
A checklist for the next "X linked to lower risk" headline
Who is in the sample? If everyone has a diagnosis, ask whether the exposure also affects who gets diagnosed.
When was the exposure measured? Before the illness, or after it may already have changed things?
Could the outcome be causing the exposure? Weight loss before diagnosis is the classic case.
Who didn't make it into the data? Survivors can be a very different group.
Relative or absolute? "27% lower risk" means little until you know the baseline.
The same five questions work for churn analysis, A/B test segments and any dashboard filtered to "active users". If you're reading official survey data, our guide to India's PLFS unemployment numbers applies the same habit of asking who is counted. Filter a population on an outcome, and you may be looking at the filter, not the effect.