How Box Plots Help Students Understand Data
Statistics becomes easier to understand when numerical information is presented visually. One useful chart for students learning statistics is the box plot, also known as the box-and-whisker plot.
What Is a Box Plot?
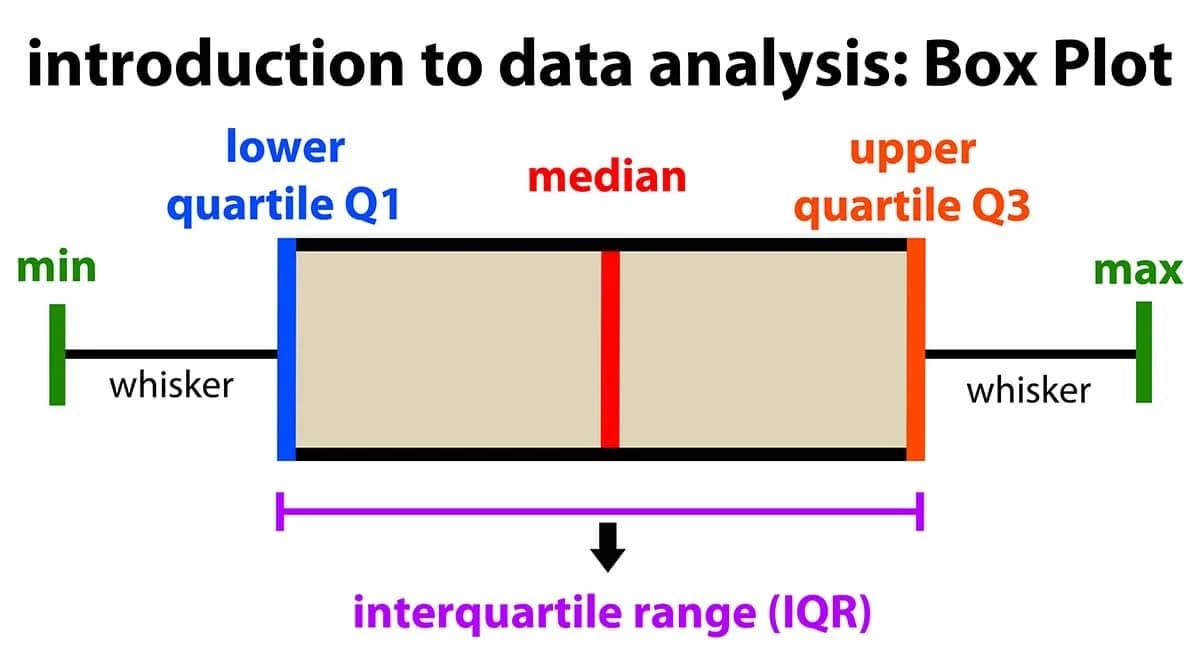
A box plot is a graph that summarises the distribution of numerical data. It displays the median, quartiles and spread of the observations. It can also highlight potential outliers, helping students understand how values differ within a dataset.
Why Are Box Plots Important for Students?
1. Simplify Data Interpretation
A box plot provides a quick visual summary of a dataset. Instead of examining every individual value, students can understand the centre and spread of the data more easily.
2. Understand Quartiles and the Median
The median represents the middle of an ordered dataset. The first and third quartiles help show how the data is distributed around the median.
3. Compare Different Groups
Box plots can be used to compare examination marks, sales figures or other numerical measurements across different groups.
4. Recognise Potential Outliers
Unusually high or low values may appear separately from the whiskers. These observations can be investigated to understand whether they represent genuine differences or possible data errors.
Create a Box Plot Online
Students do not always need complicated software to visualise numerical data. This free online box plot generator can help users create a box-and-whisker plot and explore important features of their datasets.
Conclusion
Box plots are valuable learning tools because they help students understand data distribution, variability and potential outliers. Practising with real datasets can make statistical concepts easier to interpret and apply.